Recently updated: May 20th, 2026
Google Analytics 4 (GA4) is the most significant evolution in web analytics since Google first launched the platform. With Universal Analytics permanently retired in July 2024, every marketer and business owner must now rely on GA4 to understand their audience, measure campaign performance, and make data-driven decisions.
This comprehensive guide covers everything you need to master GA4 in 2026 — from initial account setup and event tracking to conversion configuration, advanced reporting, and integrating GA4 with Google Search Console for SEO. Whether you are new to analytics or migrating from Universal Analytics, this step-by-step walkthrough will help you unlock the full power of GA4.
According to recent statistics, over 9 million websites now use Google Analytics 4 as their primary analytics platform, making it the industry standard for measuring digital marketing performance.
What Is Google Analytics 4?
Google Analytics 4 is Google’s current-generation analytics platform, built on an event-based data model that records every user interaction — a page view, a button click, a form submission, a video play — as a standalone event with attached parameters. This is a fundamental departure from Universal Analytics, which grouped interactions into sessions.
GA4 was launched from Beta in October 2020 and became the mandatory standard after Universal Analytics was permanently shut down in July 2024. The platform is designed to address three major shifts in the digital landscape: the rise of cross-platform user journeys (web plus app), stricter global privacy regulations, and the decline of third-party cookies.
At its core, GA4 uses machine learning and artificial intelligence to fill data gaps caused by privacy controls, model behaviour for users who have declined cookies, and surface predictive insights without requiring manual query writing.
GA4 vs Universal Analytics: Key Differences
If you are transitioning from Universal Analytics (UA), understanding the core architectural differences is essential. The table below summarises what has changed and why it matters for your marketing strategy.
| Feature |
Universal Analytics (retired) |
Google Analytics 4 |
| Data model |
Session-based (hits within a session) |
Event-based (every interaction is an event) |
| Cross-platform tracking |
Separate properties for web and app |
Single property tracks web + iOS + Android |
| Bounce rate |
Sessions with a single page view |
Replaced by Engagement Rate (sessions ≥10s or 2+ views) |
| Goals / conversions |
Goal-based configuration |
Key Events marked as conversions |
| Machine learning |
Limited, enterprise-only |
Built-in predictive metrics for all users |
| Privacy compliance |
IP tracking by default; manual anonymisation |
No IP logging by default; Consent Mode v2 built-in |
| BigQuery export |
GA360 (paid) only |
Free for all properties |
| Reporting interface |
Standard reports with limited customisation |
Exploration reports with free-form, funnel, and path analysis |
Key Benefits of Google Analytics 4
GA4 delivers significant advantages over its predecessor, particularly for businesses running campaigns across multiple channels and devices. Here is a breakdown of the most impactful benefits.
Cross-Platform Web and App Tracking
GA4 unifies tracking for websites and mobile applications (iOS and Android) within a single property. Previously, you needed separate UA properties for your website and your app, making it impossible to follow a user’s journey if they first visited on desktop and then converted via the mobile app. GA4 solves this by using a consistent user identifier across platforms, giving you a complete view of the customer journey without stitching data from multiple sources.
This cross-platform tracking is particularly valuable for marketers managing campaigns that drive both web and app traffic, as teams can now manage analytics data from all platforms in one unified interface.
Event-Based Data Model
Every user interaction in GA4 is recorded as an event, which can carry additional detail via attached parameters. For example, a video_play event can carry parameters like video_title, video_duration, and video_percent, giving you far richer context than the pageview-centric model of Universal Analytics.
GA4 also provides Enhanced Measurement, which automatically tracks scroll depth, outbound link clicks, site search, video engagement, and file downloads — all without writing a single line of custom code.
Predictive Metrics and AI-Powered Insights
GA4’s built-in machine learning generates predictive metrics that were previously only available in enterprise analytics platforms. These include:
- Purchase probability — the likelihood that a user who was active in the last 28 days will make a purchase in the next 7 days.
- Churn probability — the likelihood that an active user will not return in the next 7 days.
- Predicted revenue — the revenue expected from a user in the next 28 days.
These predictive audiences can be pushed directly to Google Ads for remarketing, helping you focus ad spend on the users most likely to convert.
Privacy-First Design and Consent Mode
GA4 was built for a privacy-first web. It does not log IP addresses by default, uses modelled data for users who decline cookies, and supports Consent Mode v2 — a framework that allows GA4 to adjust its tracking behaviour based on each user’s consent choices, ensuring compliance with GDPR, CCPA, and other privacy regulations without sacrificing data quality.
Google Ads and BigQuery Integration
GA4 integrates natively with Google Ads, enabling you to import GA4 audience segments directly into your ad campaigns and import conversion events for bidding. The free BigQuery export allows you to query raw event-level data using SQL, making GA4 suitable for advanced data science workflows that were previously cost-prohibitive.
How to Set Up Google Analytics 4: Step-by-Step Guide
Setting up GA4 correctly from the start ensures accurate data collection. The entire process typically takes 20–30 minutes. Follow each step carefully.
Step 1: Create a GA4 Account and Property
For first-time Google Analytics users:
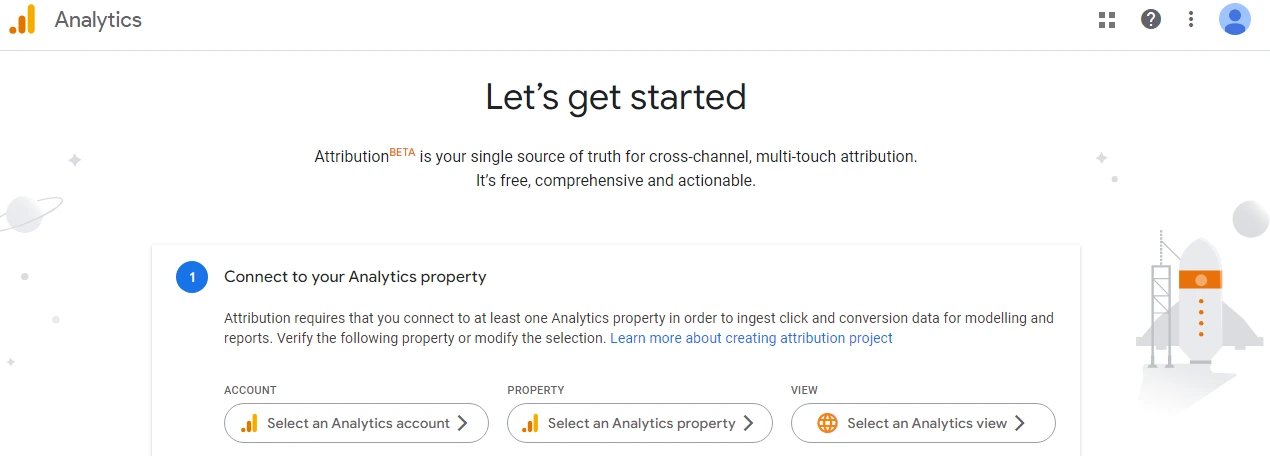
- Go to analytics.google.com and sign in with your Google account.
- Click Start measuring.
- Enter your Account name (typically your company or website name). Configure data sharing settings as preferred.
- Click Next to proceed to property creation.
For existing Google Analytics users adding a new property:
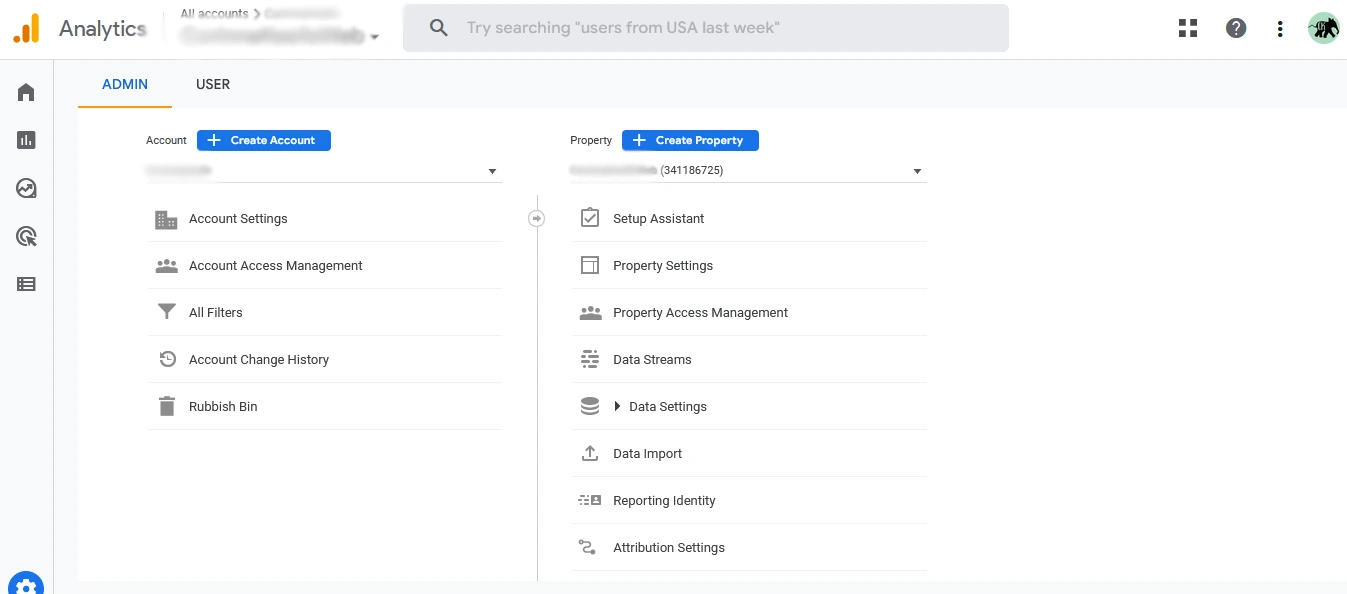
- Click the Admin cog icon in the bottom-left corner.
- Under the Account column, select the relevant account.
- Under the Property column, click Create Property.
When creating your property, enter:
- Property name — your website or app name.
- Reporting time zone — match this to your business location to ensure date-based reports are accurate.
- Currency — select the currency used in your transactions.
- Industry category — see the dedicated section below for guidance on choosing the right category for your business type.
- Business size — this affects the default report recommendations GA4 shows you.
Accept Google’s terms and conditions to complete property creation.
Step 2: Set Up a Web Data Stream and Get Your Measurement ID
A data stream tells GA4 where to collect data from. GA4 supports three stream types: Web, iOS app, and Android app.
- In Admin, under your new property, click Data Streams.
- Click Add stream and select Web.
- Enter your website URL and stream name, then click Create stream.
- Your Measurement ID (beginning with
G-) will appear at the top of the stream details page. Copy this — you will need it for the next step.
Enable Enhanced Measurement on the same screen. This toggle automatically enables tracking of scrolls, outbound clicks, site search, video engagement, and file downloads without any additional code.
Step 3: Install GA4 via Google Tag Manager (Recommended)
Google Tag Manager (GTM) is the recommended installation method because it gives marketers control over tracking setup without requiring developer access to your website’s code. It also enables version control and pre-publish testing via GTM’s built-in preview mode.
- If you do not have a GTM account, create one at tagmanager.google.com.
- In GTM, click Tags → New.
- Click Tag Configuration and select Google Tag.
- Enter your GA4 Measurement ID (the
G-XXXXXXX code from Step 2).
- Under Triggering, select All Pages.
- Name the tag (e.g. “GA4 Configuration”) and click Save.
- Click Submit in GTM to publish the container.
GTM’s flexibility means that when you need to add or modify tracking in the future, you can do so directly in the GTM interface without editing website code again.
Step 4: Add GA4 to WordPress (Plugin Method)
If you manage a WordPress site and prefer not to use GTM, you can install GA4 directly via a plugin:
- In your WordPress dashboard, go to Plugins → Add New.
- Search for GA4WP or MonsterInsights.
- Install and activate the plugin.
- In the plugin settings, paste your GA4 Measurement ID (
G-XXXXXXX) into the designated field.
- Save settings.
For CMS platforms other than WordPress that do not support the Measurement ID field directly, you can add GA4 by copying the global site tag (gtag.js) from Admin → Data Streams → Web → Tagging Instructions → Add new on-page tag → Global site tag, then pasting it into the custom HTML section of your CMS.
Step 5: Enable Enhanced Measurement
Enhanced Measurement is one of GA4’s most powerful time-saving features. Once enabled, GA4 automatically tracks the following events without additional code:
- Scrolls — fires when a user reaches 90% of a page’s depth.
- Outbound clicks — tracks links that navigate away from your domain.
- Site search — records what users search for on your site.
- Video engagement — tracks play, pause, progress, and completion for embedded YouTube videos.
- File downloads — fires when a user clicks on a downloadable file (PDF, DOCX, XLSX, etc.).
To confirm Enhanced Measurement is active, go to Admin → Data Streams → [Your Web Stream] → Enhanced Measurement and verify the toggle is enabled.
Step 6: Verify Your GA4 Setup with Real-Time Reports
- Open your website in a separate browser tab.
- In GA4, navigate to Reports → Real-time.
- If GA4 is correctly installed, you will see your own session appear in the report within seconds, showing your location, the page you are viewing, and the events being fired.
Note: Data in standard reports (outside Real-time) typically takes 24–48 hours to appear. Use DebugView (Admin → DebugView) during setup to test individual events in real time without waiting.
Choosing the Right Industry Category in GA4 (For SEO Companies and Digital Agencies)
When creating your GA4 property, Google asks you to select an Industry category. This setting influences the default benchmark data GA4 shows you (comparing your performance against similar businesses) and the default reports and insights it surfaces.
If you run an SEO company, digital marketing agency, or professional services firm, the recommended category is “Business and industrial markets” or “Professional services”, depending on which is available. As of 2026, the closest match for most SEO and digital marketing agencies is:
- Primary recommendation: Business and industrial markets → Marketing and advertising
- Alternative: Online communities → Professional services
The industry category does not affect how GA4 collects your data — it only influences benchmarking comparisons and the suggested insights panel on your GA4 home screen. You can update this setting at any time in Admin → Property Settings → Industry Category.
For agencies managing multiple clients’ GA4 properties, the best practice is to set each client’s property to reflect their industry, not your agency’s industry — so a property for a retail client should be set to “Retail” and a property for a healthcare client to “Health”.
GA4 Event Tracking: Auto-Collected, Recommended and Custom Events
Understanding GA4’s event taxonomy is fundamental to getting accurate, actionable data. GA4 organises events into four categories:
| Event type |
How it works |
Examples |
| Automatically collected |
Fires with no setup required |
session_start, first_visit, page_view |
| Enhanced Measurement |
Enabled via toggle; no code required |
scroll, click, video_start, file_download |
| Recommended events |
Pre-defined by Google, you implement them with GTM or code |
purchase, add_to_cart, sign_up, login, generate_lead |
| Custom events |
You define the name and parameters; use for business-specific interactions |
form_submit_contact, quote_request_click, brochure_download |
Automatically Collected Events
GA4 automatically fires a set of baseline events the moment tracking is installed. The most important for marketers are session_start (fires at the beginning of each new session), first_visit (fires only on a user’s very first visit and is useful for new user acquisition analysis), and page_view (fires on every page load).
Recommended Events
Google has defined a set of recommended event names for common business scenarios. Using these standardised names ensures GA4’s default reports and predictive models work correctly. For example, using purchase (instead of a custom name like order_complete) enables the Monetisation and Ecommerce purchase reports automatically. Implement recommended events via GTM by creating a new tag with the event name and the required parameters.
Custom Events: How to Create Them
When none of the recommended events match a specific interaction you want to track, you can create custom events. To create a custom event via GTM:
- In GTM, click Tags → New → Tag Configuration → Google Analytics: GA4 Event.
- Select your GA4 configuration tag.
- Enter your Event name (use snake_case; e.g.
contact_form_submit).
- Add Event parameters as needed (e.g.
form_id, page_location).
- Set the Trigger to the specific user action (e.g. form submission, button click).
- Save and publish the GTM container.
Important: Use DebugView to verify your custom event fires correctly before publishing to live users. Maintaining a naming convention document for your events ensures consistency across teams and makes reporting cleaner over time.
How to Set Up Conversion Tracking in GA4
In GA4, conversions are events that you have designated as particularly important to your business. Unlike Universal Analytics, where you configure Goals, in GA4 you simply mark any event as a Key Event (which GA4 labels as a conversion in reporting).
Marking Events as Key Conversions
- In GA4, go to Admin → Events.
- Find the event you want to treat as a conversion (e.g.
generate_lead, purchase, form_submit).
- Toggle the Mark as key event switch to ON.
- The event will now appear in Conversions reports and be available for Google Ads bidding strategies.
You can mark up to 30 events as key events per GA4 property. Prioritise events that represent genuine business value — lead form submissions, quote requests, purchases, account sign-ups, and phone click-to-call events.
GA4 Ecommerce Conversion Tracking
For ecommerce businesses, GA4 supports a comprehensive set of recommended ecommerce events that enable the full Monetisation and Ecommerce reporting suite. The core ecommerce event sequence is:
view_item_list → view_item → add_to_cart → begin_checkout → add_payment_info → purchase
Each event passes an items array containing product-level detail (item ID, name, category, price, quantity). Implementation is typically done via GTM with a Data Layer push from your ecommerce platform. Platforms like Shopify and WooCommerce have native GA4 integrations that handle most of this automatically.
Once ecommerce events are firing, GA4’s Monetisation reports will show you revenue by channel, product performance, shopping cart abandonment rates, and checkout funnel completion — giving you the data you need to optimise your ecommerce strategy.
Maximising Data: Audiences, Engagement Rate and Content Consumption
GA4 provides a significantly richer set of data dimensions compared to Universal Analytics. Here are the three most powerful areas to leverage for marketing insight.
Audience Segmentation in GA4
GA4’s audience builder allows you to create highly granular audience segments based on combinations of event data, user properties, demographic information, and predictive metrics. Audiences can be used for both analytics analysis and as remarketing lists in Google Ads.
You can create audiences based on behaviour sequences rather than just single events. For example, you could create an audience of users who watched a product video more than twice in a week and then added an item to the cart in a subsequent session — and then target that specific group with a tailored ad campaign focused on completing the purchase.
GA4 also provides predictive audiences built automatically by machine learning, including:
- Likely 7-day purchasers — users likely to purchase within the next 7 days.
- Likely 7-day churning users — active users unlikely to return within 7 days.
- Predicted top spenders — users with the highest predicted revenue in the next 28 days.
GA4 allows you to use the same audience definition for both your analytics reports and your Google Ads campaigns, eliminating the inconsistency between ad platform audiences and analytics segments that was common in Universal Analytics.
Engagement Rate vs Bounce Rate
One of the most discussed changes in GA4 is the replacement of bounce rate with Engagement Rate. Understanding the distinction is important for interpreting your data correctly.
Engagement Rate is defined as the percentage of sessions that are classified as engaged. A session is classified as engaged if it lasts longer than 10 seconds, has a conversion event, or contains 2 or more page views or screen views. The Engagement Rate is the inverse metric to the Engaged Session Rate — not to the old UA Bounce Rate.
Bounce Rate in GA4 is the percentage of sessions that were NOT engaged — i.e. sessions shorter than 10 seconds with a single page view and no conversion. This is actually a more useful signal of low-quality traffic than the UA Bounce Rate, because GA4’s model distinguishes between a user who read a full article in under 10 seconds (rare) and one who genuinely bounced.
Engagement Rate metrics are more useful than the previous bounce rate feature because they are more effective in analysing genuine user interest. GA4 is also better at filtering out bot traffic, making your engagement data cleaner.
Content Consumption Tracking
GA4’s Enhanced Measurement scroll tracking records a scroll event when a user reaches 90% of a page’s vertical depth. Combined with session duration and engagement time metrics, this gives you a three-signal picture of content consumption:
- Time on page — how long a user spent on the content.
- Scroll depth — whether they read to the end.
- Engagement classification — whether their session met the engaged session threshold.
Use these signals to identify your best-performing content (high time on page + high scroll completion + low bounce rate) and replicate those content patterns across your site. Pages with high impressions but low engagement time signal a content quality or relevance mismatch that should be addressed.
GA4 Reports Explained: Your Complete Navigation Guide
GA4’s reporting interface is organised differently from Universal Analytics. The left-hand navigation has four main areas: Home, Reports, Explore, and Advertising. Here is what each contains and when to use it.
Life Cycle Reports: Acquisition, Engagement, Monetisation and Retention
The Reports section contains the built-in Life Cycle report collection, organised around the user journey:
- Acquisition reports tell you where your users and sessions are coming from — organic search, paid search, direct, referral, social, email, and other channels. The User acquisition report focuses on the channel that brought a user to your site for the first time, while Session acquisition shows the channel responsible for each individual session.
- Engagement reports show what users are doing on your site — which pages and screens are most visited, which events are being fired most frequently, and which conversion events are occurring. The Pages and screens report is the GA4 equivalent of the UA All Pages report.
- Monetisation reports cover revenue-related data including ecommerce purchases, in-app purchases, and publisher ads revenue. For ecommerce sites, the Ecommerce purchases report provides a product-level breakdown of views, adds-to-cart, and purchases.
- Retention reports show how well your product retains users over time, including user retention curves and engagement by cohort — data that is particularly valuable for subscription businesses and app developers.
Exploration Reports: Funnel, Path and Segment Overlap Analysis
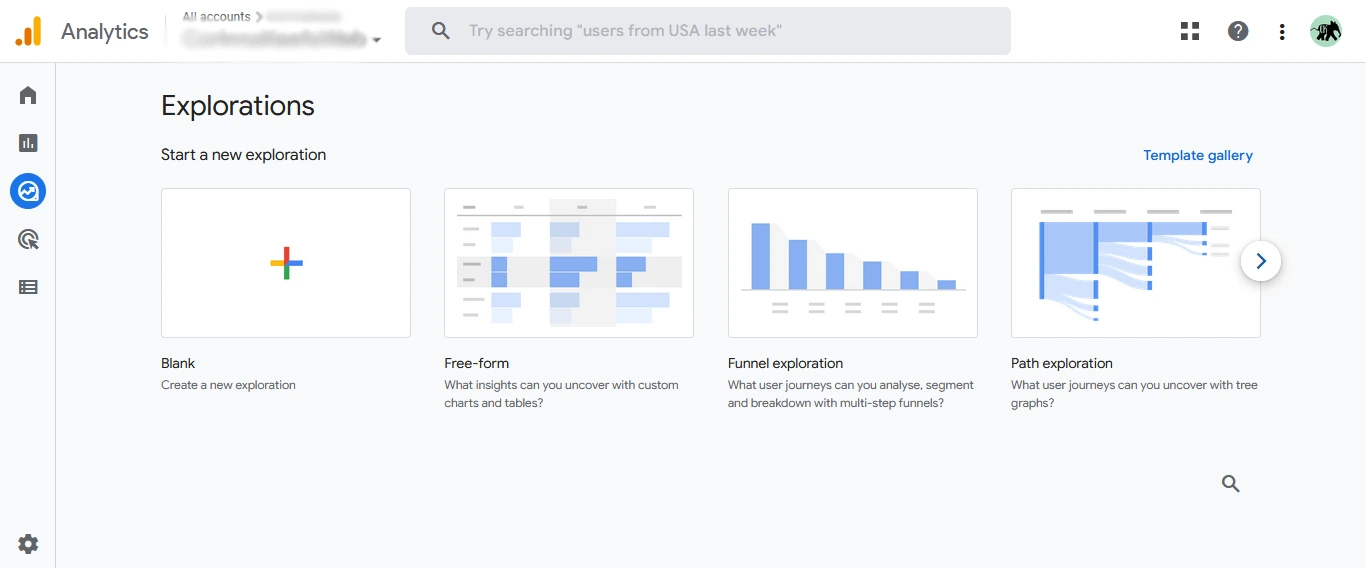
The Explore section is where GA4 truly differentiates itself from Universal Analytics. Exploration reports allow you to build completely custom analyses using a drag-and-drop interface. The most valuable exploration types for marketers are:
- Funnel exploration — build a multi-step funnel (e.g. Product view → Add to cart → Checkout → Purchase) and see where users drop off at each stage. You can segment funnels by device type, traffic source, or any other dimension.
- Path exploration — visualise the actual paths users take through your site, both forward from a starting page and backward from an ending page. This is invaluable for understanding unexpected navigation patterns.
- Segment overlap — compare the size and overlap of up to three different audience segments to understand which user characteristics co-occur most frequently.
- Free form exploration — a blank canvas where you can combine any dimensions and metrics into a pivot table or chart.
GA4 includes a Thresholds privacy feature in Exploration reports. If the data in a report could potentially be used to identify individual users, GA4 withholds that data from the report. This protects user privacy but can occasionally result in incomplete data for very low-traffic segments.
Real-Time Reports
GA4’s Real-time report shows activity on your site over the last 30 minutes. It displays active users by page, by traffic source, by device category, and by geography. Real-time is particularly useful for:
- Verifying a new GA4 implementation is working correctly (your own visit should appear immediately).
- Monitoring traffic spikes during a campaign launch or a social media mention.
- Checking that a new conversion event fires correctly after deploying a GTM change.
Linking GA4 with Google Search Console for SEO Insights
One of the most valuable but underutilised GA4 integrations for marketers and SEO professionals is the connection between GA4 and Google Search Console. Once linked, you can see organic search query data — the actual keywords users searched on Google before clicking through to your site — directly within your GA4 reports.
To link Google Search Console to GA4:
- In GA4, go to Admin → Property Settings → Search Console Links.
- Click Link.
- Select your Search Console property from the list (your site must already be verified in Search Console).
- Select the web data stream to associate with the Search Console property.
- Click Submit.
After linking, a new Search Console collection will appear in your Reports left-hand navigation with two reports:
- Google organic search queries — shows which search queries drive traffic to your site, with clicks, impressions, CTR, and average position.
- Google organic search traffic — shows organic search traffic broken down by landing page, letting you connect organic clicks to on-site user behaviour like engagement time and conversions.
This integration is a critical tool for SEO strategy, as it lets you identify pages with high impressions but low CTR (where a title tag or meta description improvement could drive significant traffic gains), and pages with high organic traffic but low conversion rates (where content or UX improvements are needed). It bridges the gap between search performance data and on-site behaviour data in a single interface.
Exporting GA4 Data to BigQuery and Looker Studio
GA4’s free BigQuery integration is one of the platform’s most powerful features, allowing you to export raw event-level data to Google Cloud’s data warehouse for advanced analysis.
To set up BigQuery export:
- Go to Admin → Property column → BigQuery Links.
- Click Link and select your Google Cloud project (or create a new one).
- Choose the data location and export frequency (daily or streaming).
- Click Submit.
Once your data is in BigQuery, you can query it with SQL to answer questions that GA4’s built-in interface cannot answer — for example, calculating the exact number of users who triggered a specific sequence of events in a custom time window, or building machine learning models on your raw behavioural data.
Connecting BigQuery to Looker Studio (formerly Google Data Studio) allows you to build highly customised, shareable marketing dashboards that pull from your raw GA4 data rather than the aggregated data in GA4’s interface:
- In Looker Studio, click Create → Report.
- Select BigQuery as the data source.
- Connect to your GA4 BigQuery dataset.
- Build charts and tables using the raw event data fields.
Looker Studio lets you create comprehensive reports for clients and stakeholders without giving them access to your GA4 property directly. It is an essential tool for digital marketing agencies managing multiple client accounts.
GA4 Privacy, Consent Mode and GDPR Compliance
As privacy regulations continue to tighten globally — GDPR in Europe, CCPA in California, and PDPA in India among others — GA4 has been designed with privacy compliance as a core feature rather than an afterthought.
Key privacy features in GA4:
- No IP address logging — GA4 does not log or store IP addresses by default, eliminating one of the primary GDPR compliance concerns of Universal Analytics.
- Data retention controls — you can set how long GA4 retains user-level and event-level data (2 months or 14 months). After this period, aggregate data remains but user-specific data is deleted.
- Consent Mode v2 — a framework that adjusts GA4’s tracking behaviour based on each user’s consent choices via your cookie banner. If a user declines cookies, GA4 uses modelled (AI-estimated) data to fill gaps, ensuring your reports remain useful even for non-consenting users while staying compliant.
- Cookieless measurement — GA4 can operate with modelled data for users who block cookies entirely, making it more resilient to browser tracking prevention (Safari ITP, Firefox ETP) than Universal Analytics.
To implement Consent Mode v2: You need to use a compatible Consent Management Platform (CMP) such as OneTrust, Cookiebot, or Termly. These platforms integrate with GTM’s Consent Mode template to automatically signal consent status to GA4 based on each user’s banner selection. Consent Mode v2 is required for Google’s EU User Consent Policy compliance and is essential for any website with traffic from the European Economic Area.
For businesses concerned about data residency, note that GA4 processes data on Google’s global server infrastructure, which includes servers in the United States. If your business requires EU data residency, review Google’s data processing terms and consider whether the GA4 data retention settings align with your organisation’s privacy policy.
Frequently Asked Questions About Google Analytics 4
What happened to Universal Analytics? Can I still access it?
Universal Analytics was permanently shut down by Google on 1 July 2024. All Universal Analytics properties are no longer accessible, and historical UA data has been deleted. If your business had not migrated to GA4 before this date, that historical data is gone. Going forward, GA4 is the only Google Analytics option available.
Which industry category should I choose in GA4 for an SEO company or digital marketing agency?
For an SEO company or digital marketing agency, the most appropriate industry category in GA4 is “Business and industrial markets” with the sub-category “Marketing and advertising,” if available in your region’s dropdown. Alternatively, “Professional services” under “Online communities” is a close second. This setting only affects benchmarking comparisons and suggested insights — it does not change how your data is collected. Remember to set each client’s GA4 property to reflect their industry, not yours.
How is GA4 different from Google Analytics 3 (Universal Analytics)?
The core difference is the data model. Universal Analytics used a session-hit model where interactions were grouped into sessions. GA4 uses an event-based model where every user interaction is recorded as an independent event with attached parameters. GA4 also unifies web and app tracking in a single property, replaces bounce rate with engagement rate, provides free BigQuery export, has built-in machine learning predictive metrics, and is designed with privacy compliance (no IP logging, Consent Mode v2) as a foundation.
Does GA4 work without Google Tag Manager?
Yes. GA4 can be installed directly by adding the gtag.js snippet to your website’s code, or via a CMS plugin (such as GA4WP for WordPress). However, Google Tag Manager is strongly recommended because it allows you to manage all tracking tags from one interface, test changes before publishing via GTM’s Preview Mode, and add or modify event tracking without editing website code. GTM makes it significantly easier to set up custom events, conversion tracking, and third-party marketing tags alongside GA4.
How do I set up conversions in GA4?
In GA4, conversions are set up by marking any event as a Key Event. Go to Admin → Events, find the event you want to treat as a conversion (such as generate_lead, purchase, or form_submit), and toggle “Mark as key event” to ON. You can mark up to 30 events per property as key events. These events will then appear in Conversions reports and can be used as conversion actions in Google Ads bidding strategies.
How long does it take for GA4 data to appear in reports?
GA4’s Real-time report displays data within seconds of events firing. Standard reports (outside Real-time) typically update within 24 to 48 hours. Exploration reports may take slightly longer to reflect very recent data. If you need to verify your tracking is working immediately after setup, use the Real-time report and GA4’s DebugView (available under Admin → DebugView) to see individual events fire in real time.
Is Google Analytics 4 free to use?
Yes. Google Analytics 4 is free for all users, including the BigQuery export feature (though Google Cloud storage costs apply for the BigQuery dataset itself at standard Cloud pricing). There is a paid enterprise tier called Google Analytics 360 that offers higher event limits, SLA guarantees, and additional features for large organisations, but the standard free version is more than sufficient for the vast majority of businesses.
Can GA4 track B2B marketing performance?
Yes, GA4 is well-suited to B2B marketing measurement. For B2B, the key configuration steps are: setting up lead generation events as key conversions (form submissions, contact requests, demo bookings), linking GA4 to Google Search Console to track which keywords drive qualified traffic, using the User Lifetime report to understand the long-term value of different acquisition sources, and creating audience segments for remarketing in Google Ads based on high-intent behaviours like visiting pricing or case study pages. GA4’s integration with CRM platforms via the Measurement Protocol also allows you to import offline conversion data (such as closed deals from your CRM) back into GA4 for full-funnel attribution.
Conclusion
Google Analytics 4 represents a genuine step forward in web analytics — not just a redesigned interface, but a fundamentally more flexible, privacy-compliant, and AI-powered platform for understanding your customers and measuring your marketing performance.
In 2026, mastering GA4 is not optional for marketers. With Universal Analytics permanently retired, GA4 is the standard. The businesses that invest time in proper setup — configuring conversion tracking, leveraging Enhanced Measurement, linking Search Console, and using Exploration reports — will have a significant analytical advantage over those who treat GA4 as a passive data repository.
The key steps to get the most from GA4 are: install correctly via Google Tag Manager, enable Enhanced Measurement, mark your most important events as key conversions, link Google Search Console for SEO insight, build custom Exploration reports for deeper analysis, and use BigQuery export for advanced data workflows. And for agencies managing client properties — set each client’s industry category to reflect their business, not yours.
If you need help setting up Google Analytics 4 for your business, configuring advanced event tracking, or building a data-driven digital marketing strategy, our team at Media Search Group is here to help. We combine over 15 years of digital marketing expertise with AI-powered analytics to deliver measurable results for our clients.
Want to see how your website is performing right now? Explore our SEO services or technical SEO audit services to get started.